From pixels to a priced decision
One platform unifies three sensor modalities and four AI models into a single, auditable crop-health view — and tells you exactly what to do next.
The data exists. We connect it.
Satellite tiles, fixed CCTV and drone flights each see a different slice of the same field at a different scale and cadence. Today that data sits in three silos and decisions still happen by eye. Vectara is the integration layer that fuses all three into one record per field.
- Satellite. Field-wide stress index, weekly cadence
- CCTV. Close-range pest activity, continuous
- Drone. Leaf-level disease, on demand
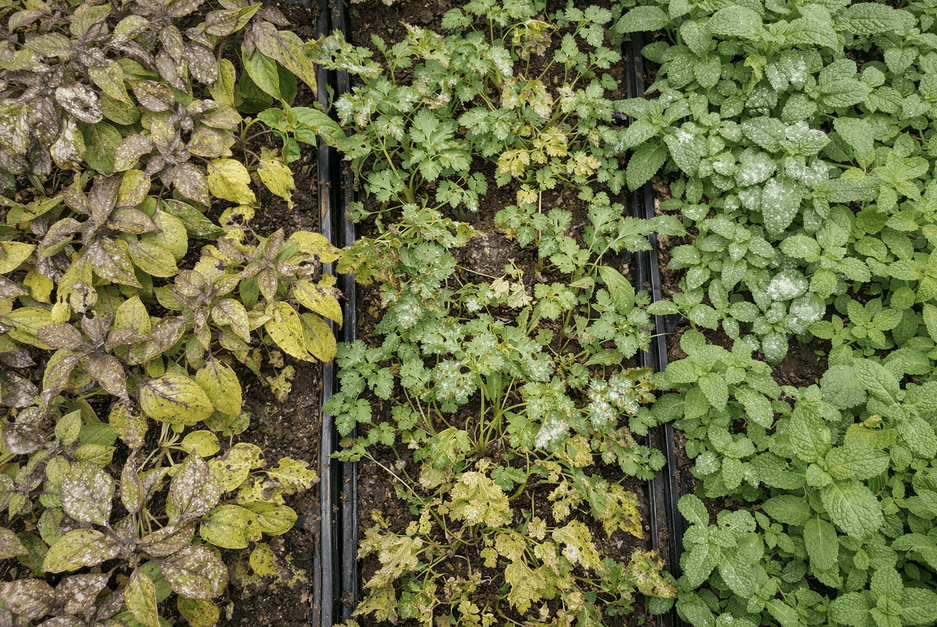
What every flight tells you
Disease Detection
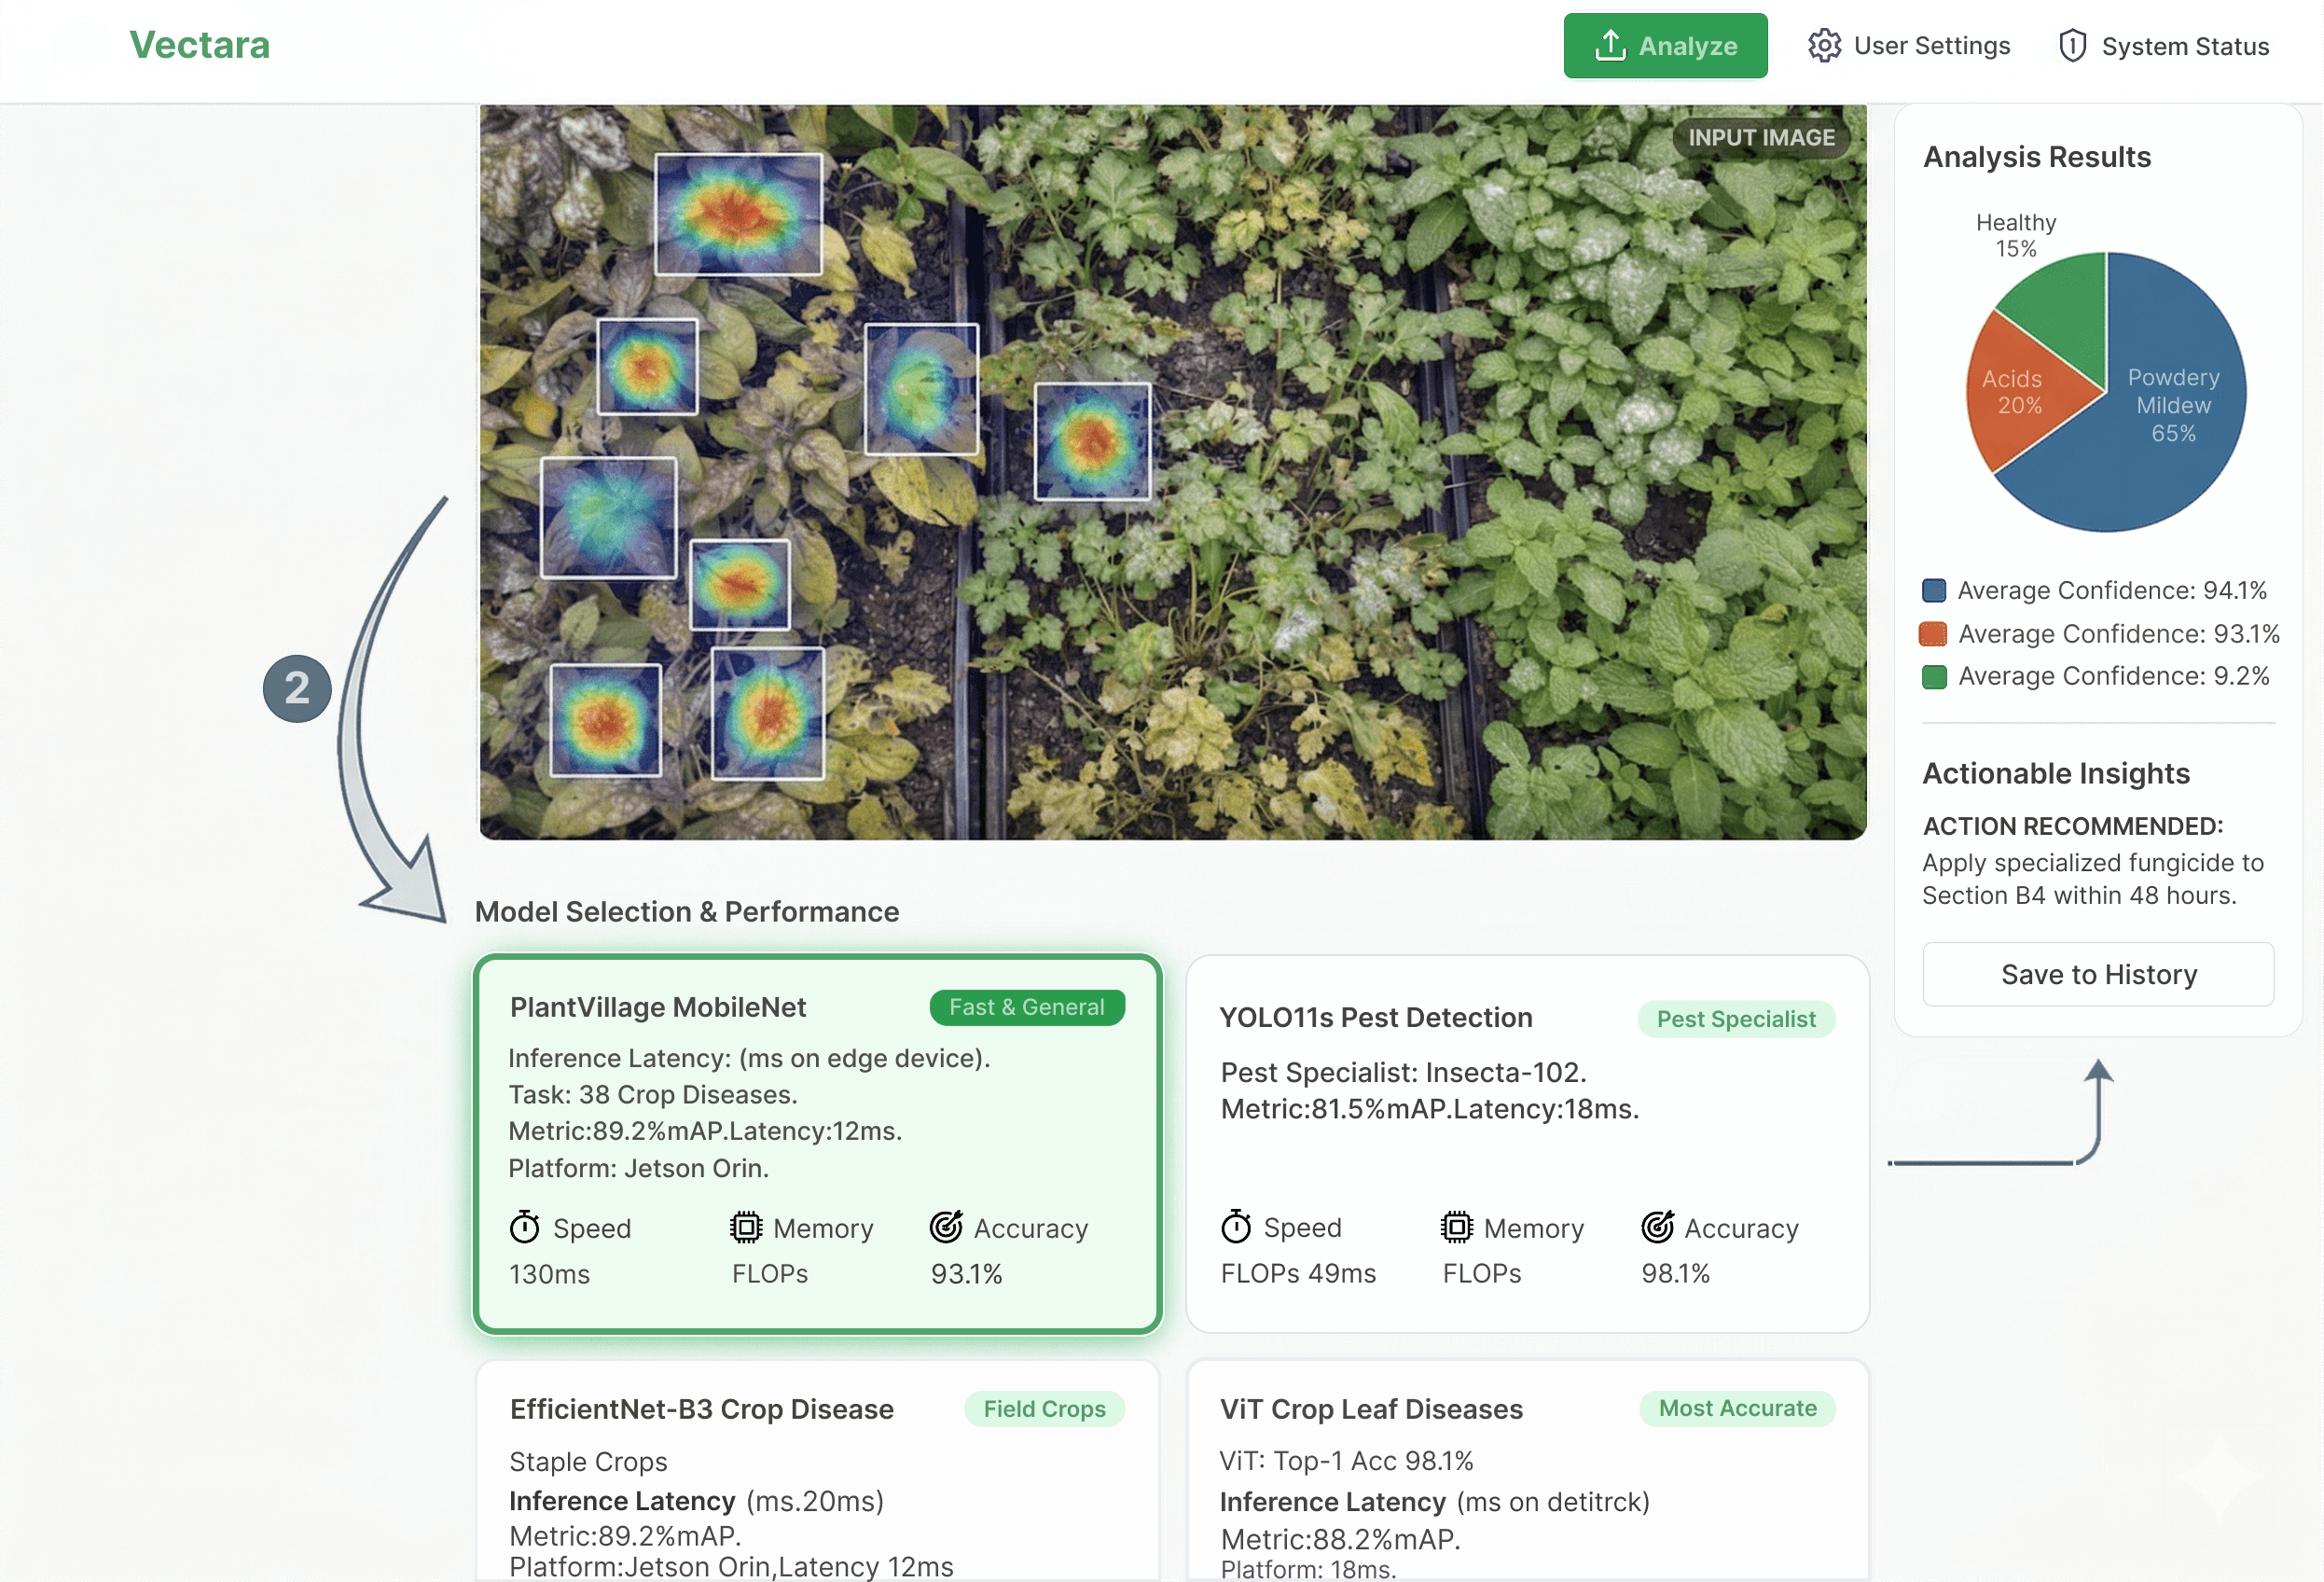
A Vision Transformer and CNN ensemble classifies blight, powdery mildew, rust, nutrient deficiency and more at symptom level — with per-zone confidence so you trust the call.
Pest Localization
A YOLO11 detector draws bounding boxes around active infestations, so treatment targets the affected rows instead of blanketing the whole field.
Crop Health Score
Every flight collapses into a single 0–100 health metric per field, broken down by healthy, stressed and affected area — a number you can track over the season.
Built to change the decision
Cost-Aware Actions
Every detection becomes a priced recommendation — “apply specialized fungicide to Section B4 within 48 hours” — quantified in euros saved.
Yield Protection
Catching disease and pests days or weeks earlier stops localized problems from spreading across a field and into the harvest.
25:1 Return
A €38 intervention that protects €950 of yield is a 25× return — and per-hectare savings stay constant as the farm scales.
Always-On Monitoring
Continuous CCTV and scheduled flights stream alerts as conditions change — and every alert is traceable back to its source frame.
Annotated, explainable, actionable
Detection overlays, a health breakdown and the recommended action — all on one screen.